

What is the Activity Flow Journal?
This is a flexible tool for logging and auditing your activities based on two primary signals: energy and engagement.
By capturing these consistently, you’ll start spotting patterns that let you:
- Adjust your schedule based on what fuels or drains you
- Make smarter decisions about what to remove, delegate, or time-block
- Design your day around high-leverage flow states
You can use it lightly or take it deeper… either way, you’re building awareness and clarity about your time.
What are we tracking and why?
The core of this practice is heavily inspired by the Good Time Journal from Designing Your Life by Bill Burnett and Dave Evans. It is a well-known tool to glean insight for personal life design.
Here is a sample of their simple method to get a feel for this process:
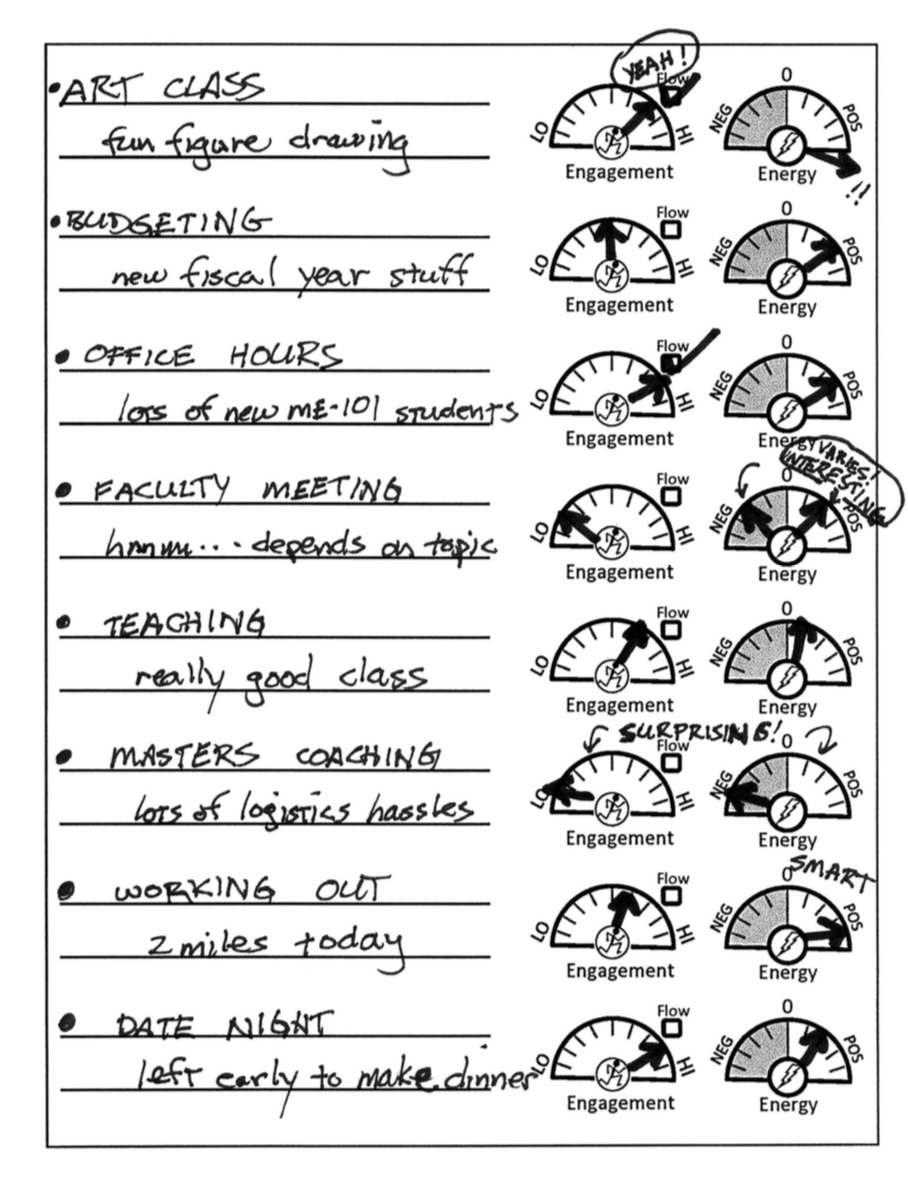
Engagement
When tracking engagement, you are assessing your ease of focus or ability to "tap in." If there is a feeling of boredom, high distractibility, and/or disinterest – engagement level is likely low. An activity that is engaging has more of your attention, for better or for worse!
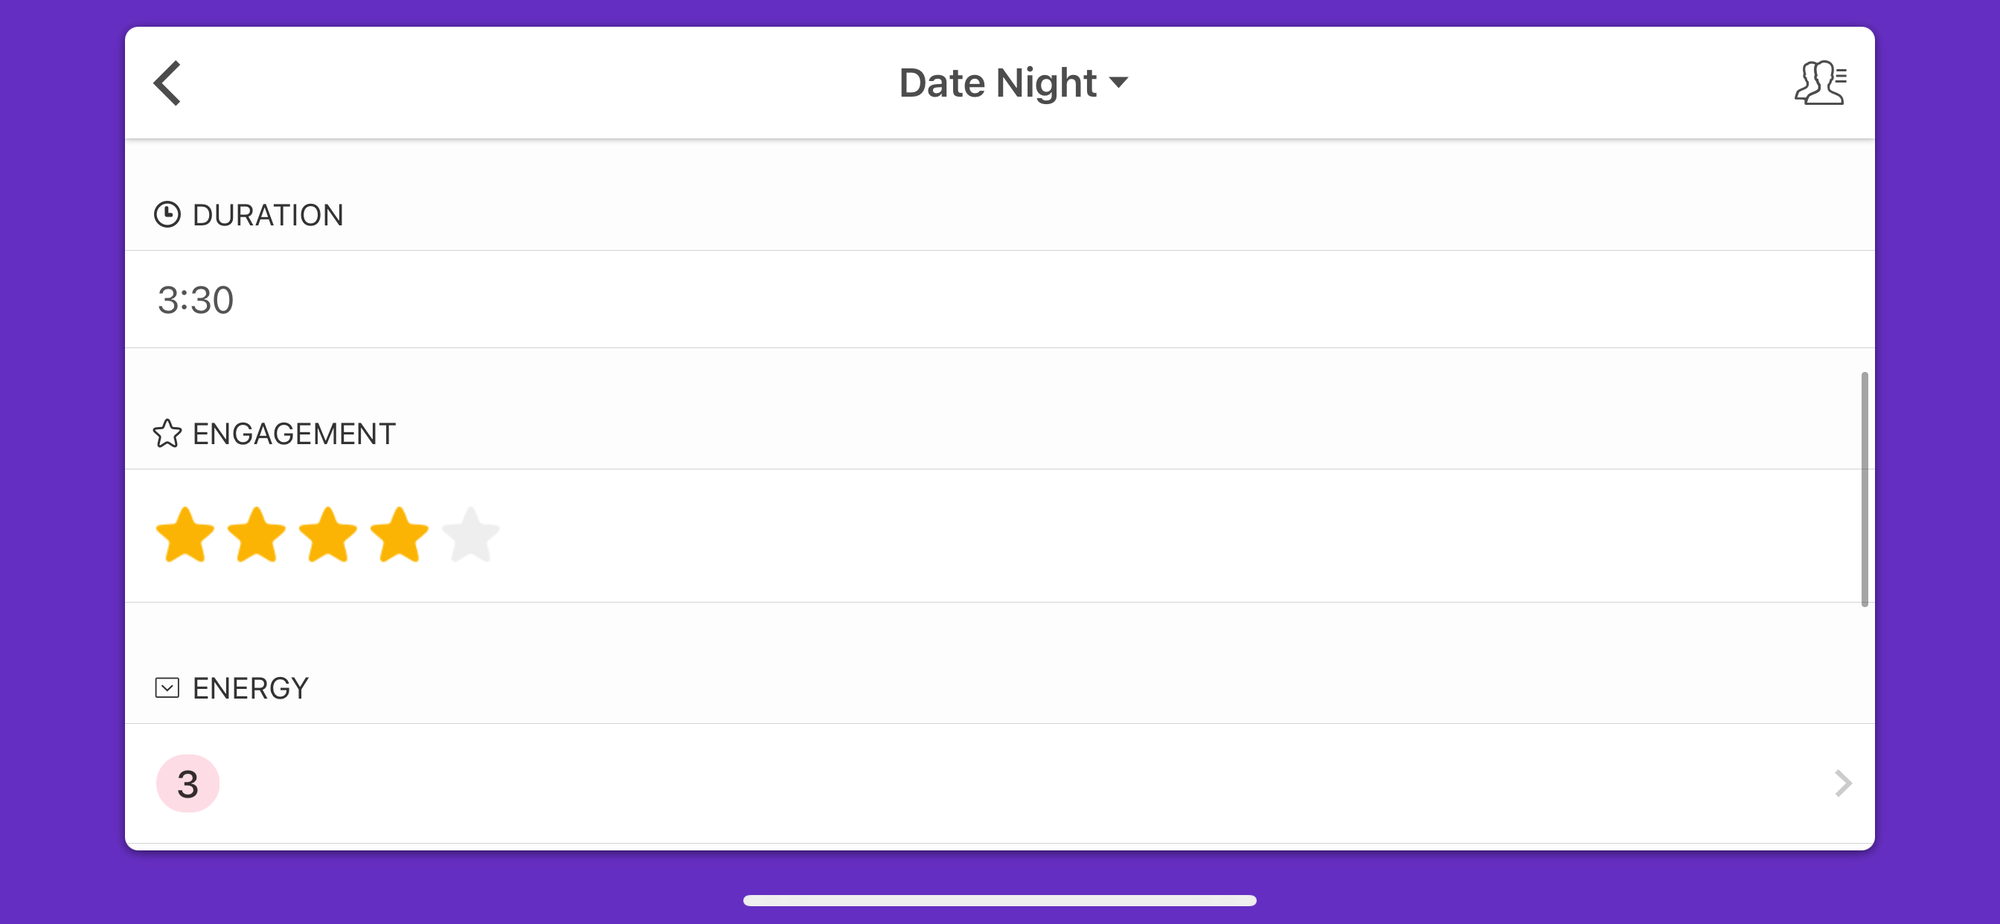
In the Activity Flow Journal, a star rating is utilized to help quantify, but visually differentiate, engagement levels of various activities.
Energy
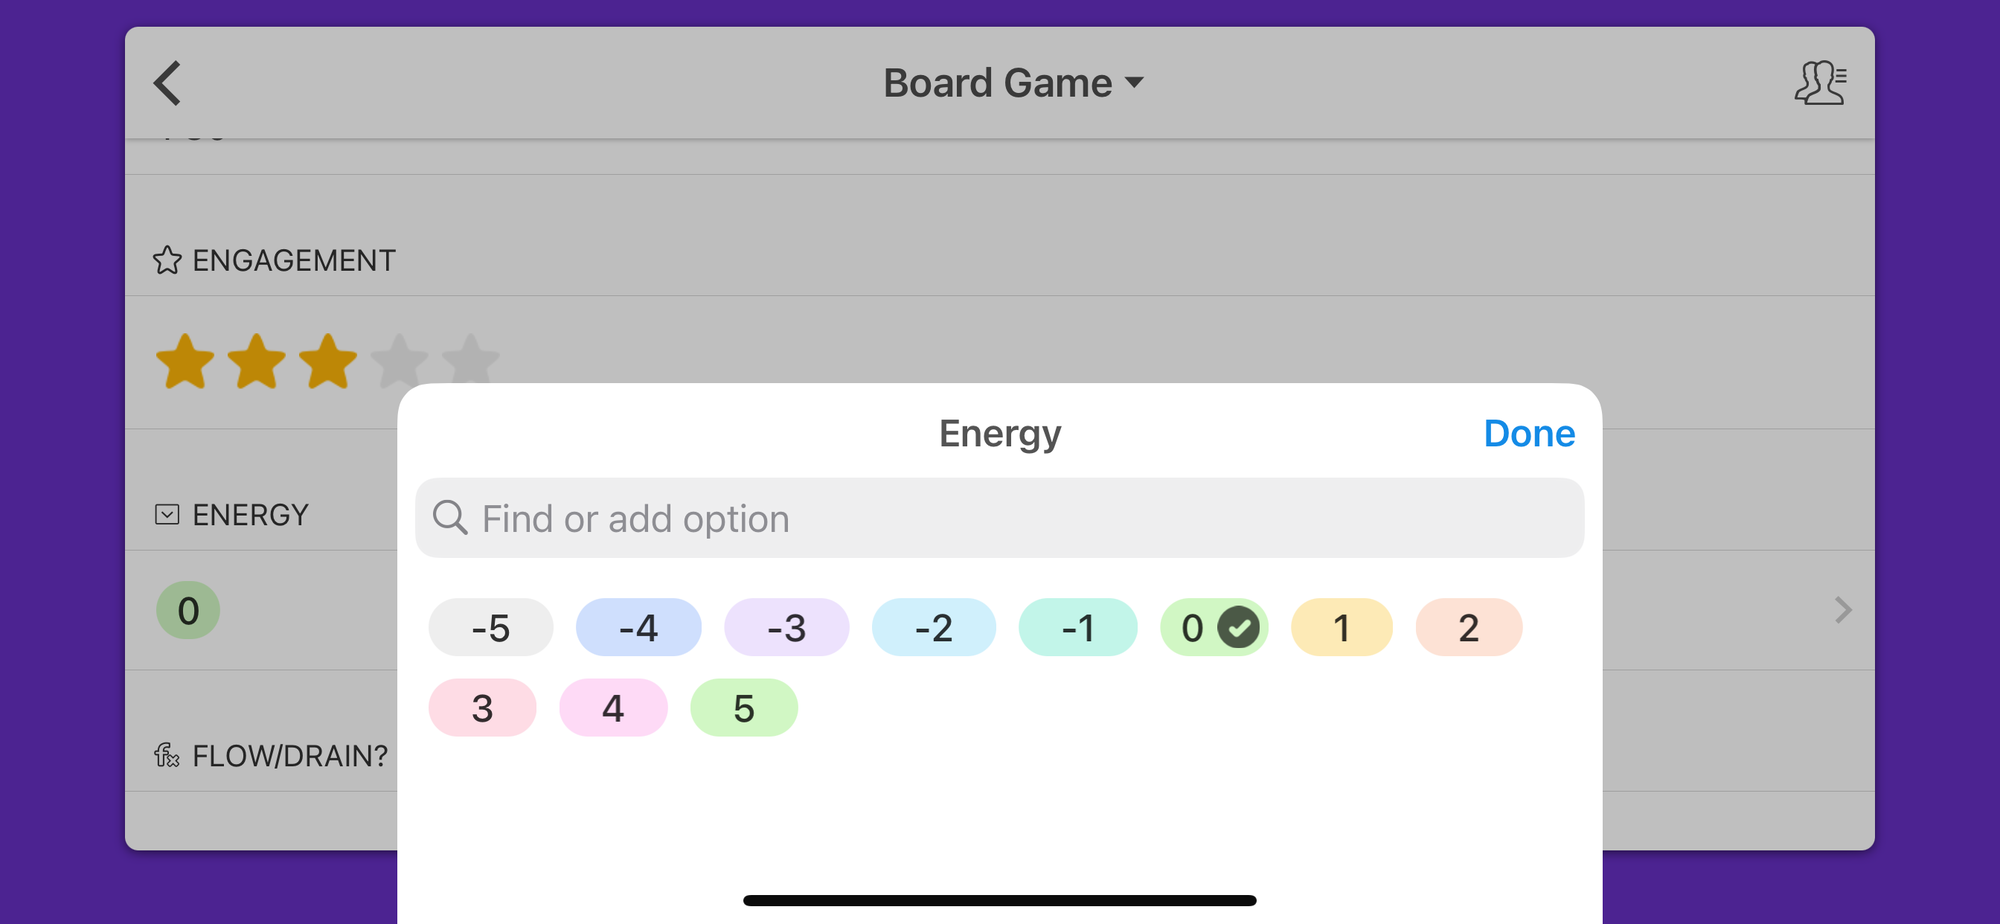
Tracking energy allows us to understand if a task or activity has refueled our energy tank (positive numerical change), did not impact energy (0-neutral, no change), or burned through our energy (negative numerical change) – and to what extent.
This is an aggregate of mental, physical, and emotional energy as an overall metric so that it can be applied more generally across activities for comparison and because changes in one type of energy will often affect the others.
Tracking energy in this practice is unlike tracking engagement -- it is not a rating of your perceived energy level at the time of the log nor during the activity. It is the qualitative measurement of the perceived positive, negative, or neutral/nonexistent energy change as a result of participating in the activity.
Flow
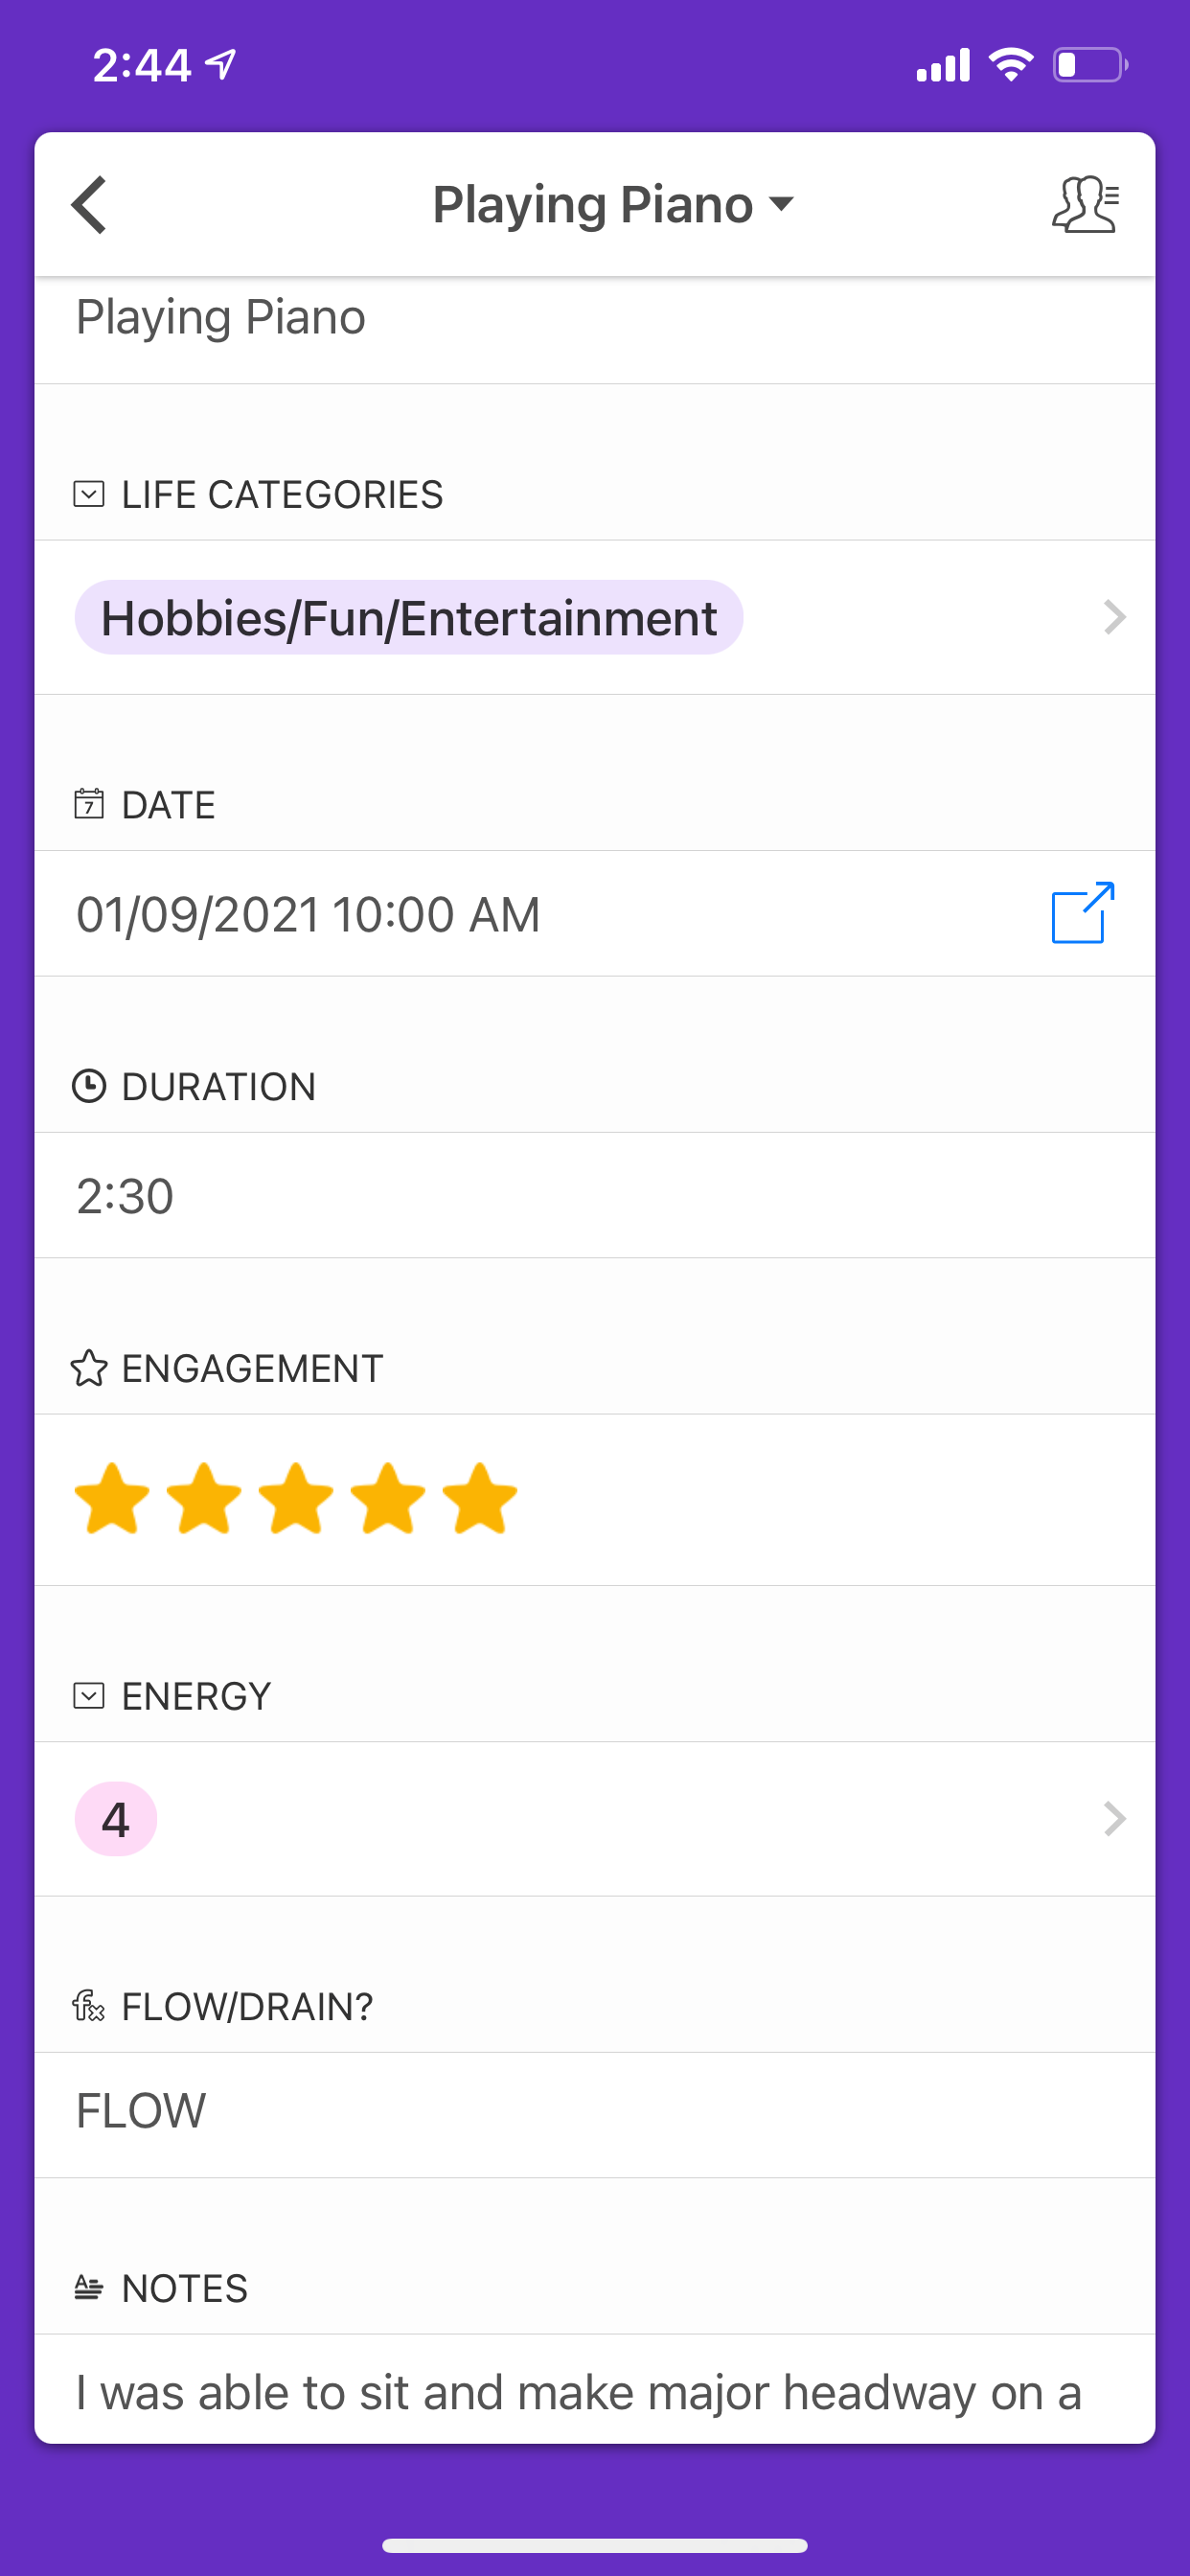
If a task is highly engaging and energizing, you might be identifying a flow activity (one that lights you up and gets you in the zone).
The concept of flow originating from positive psychology is more nuanced and can be generally represented by the graphic below:
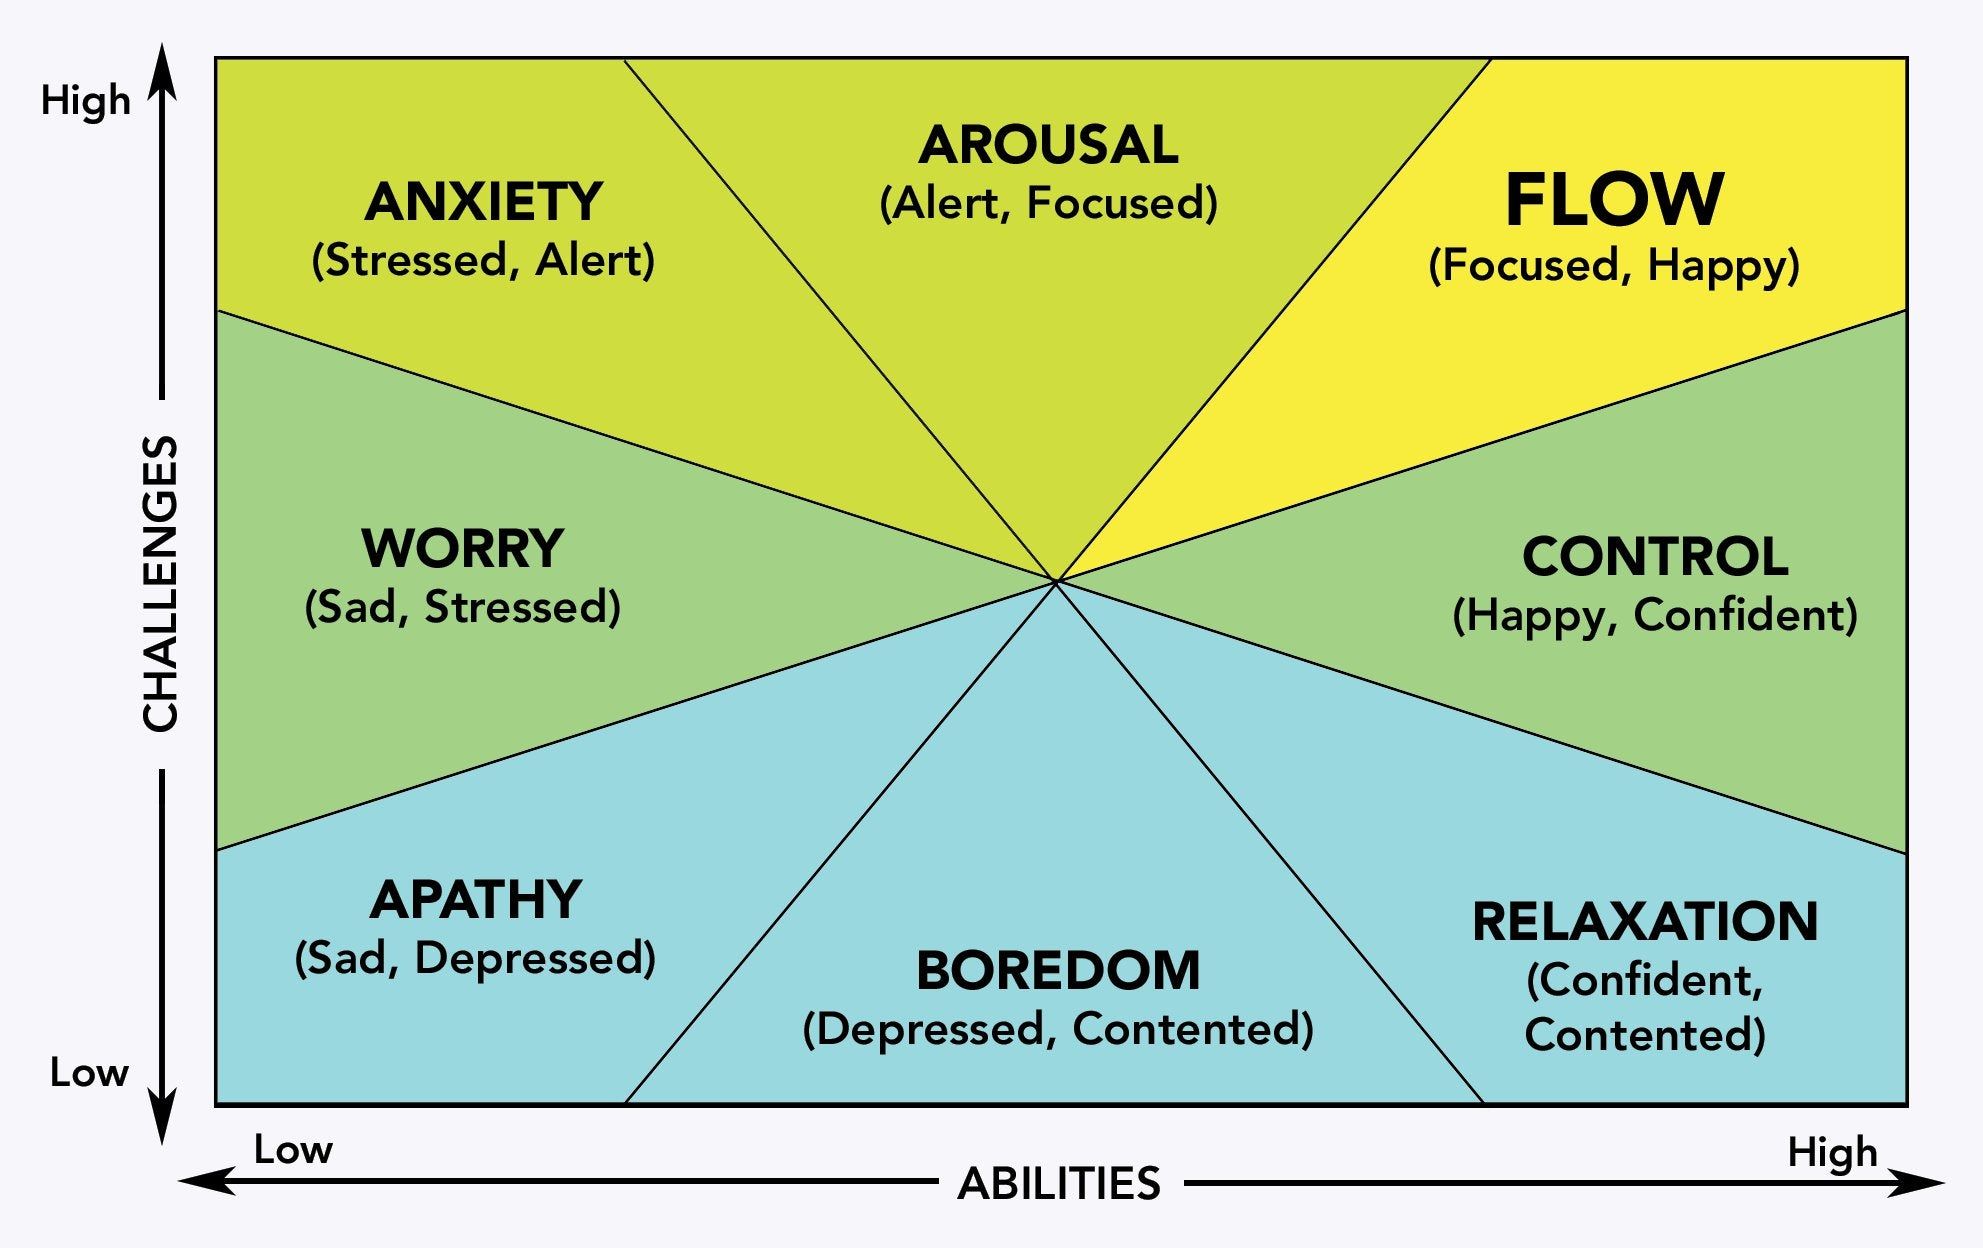
Flow, as detailed by Mihaly Csikszentmihaly, is a function of a higher level of challenge meeting high a higher level of ability.
High engagement + Positive energy impact→ Think: deep work, a great walk, a brainstorm
Identifying your flow activities lets you optimize around them.
For an in-depth look at Flow - check out this podcast and blog post.
However, there is an indicator in the template to help identify potential flow or drain activities triggered by high engagement /positive energy impact and low engagement/negative energy impact scores:
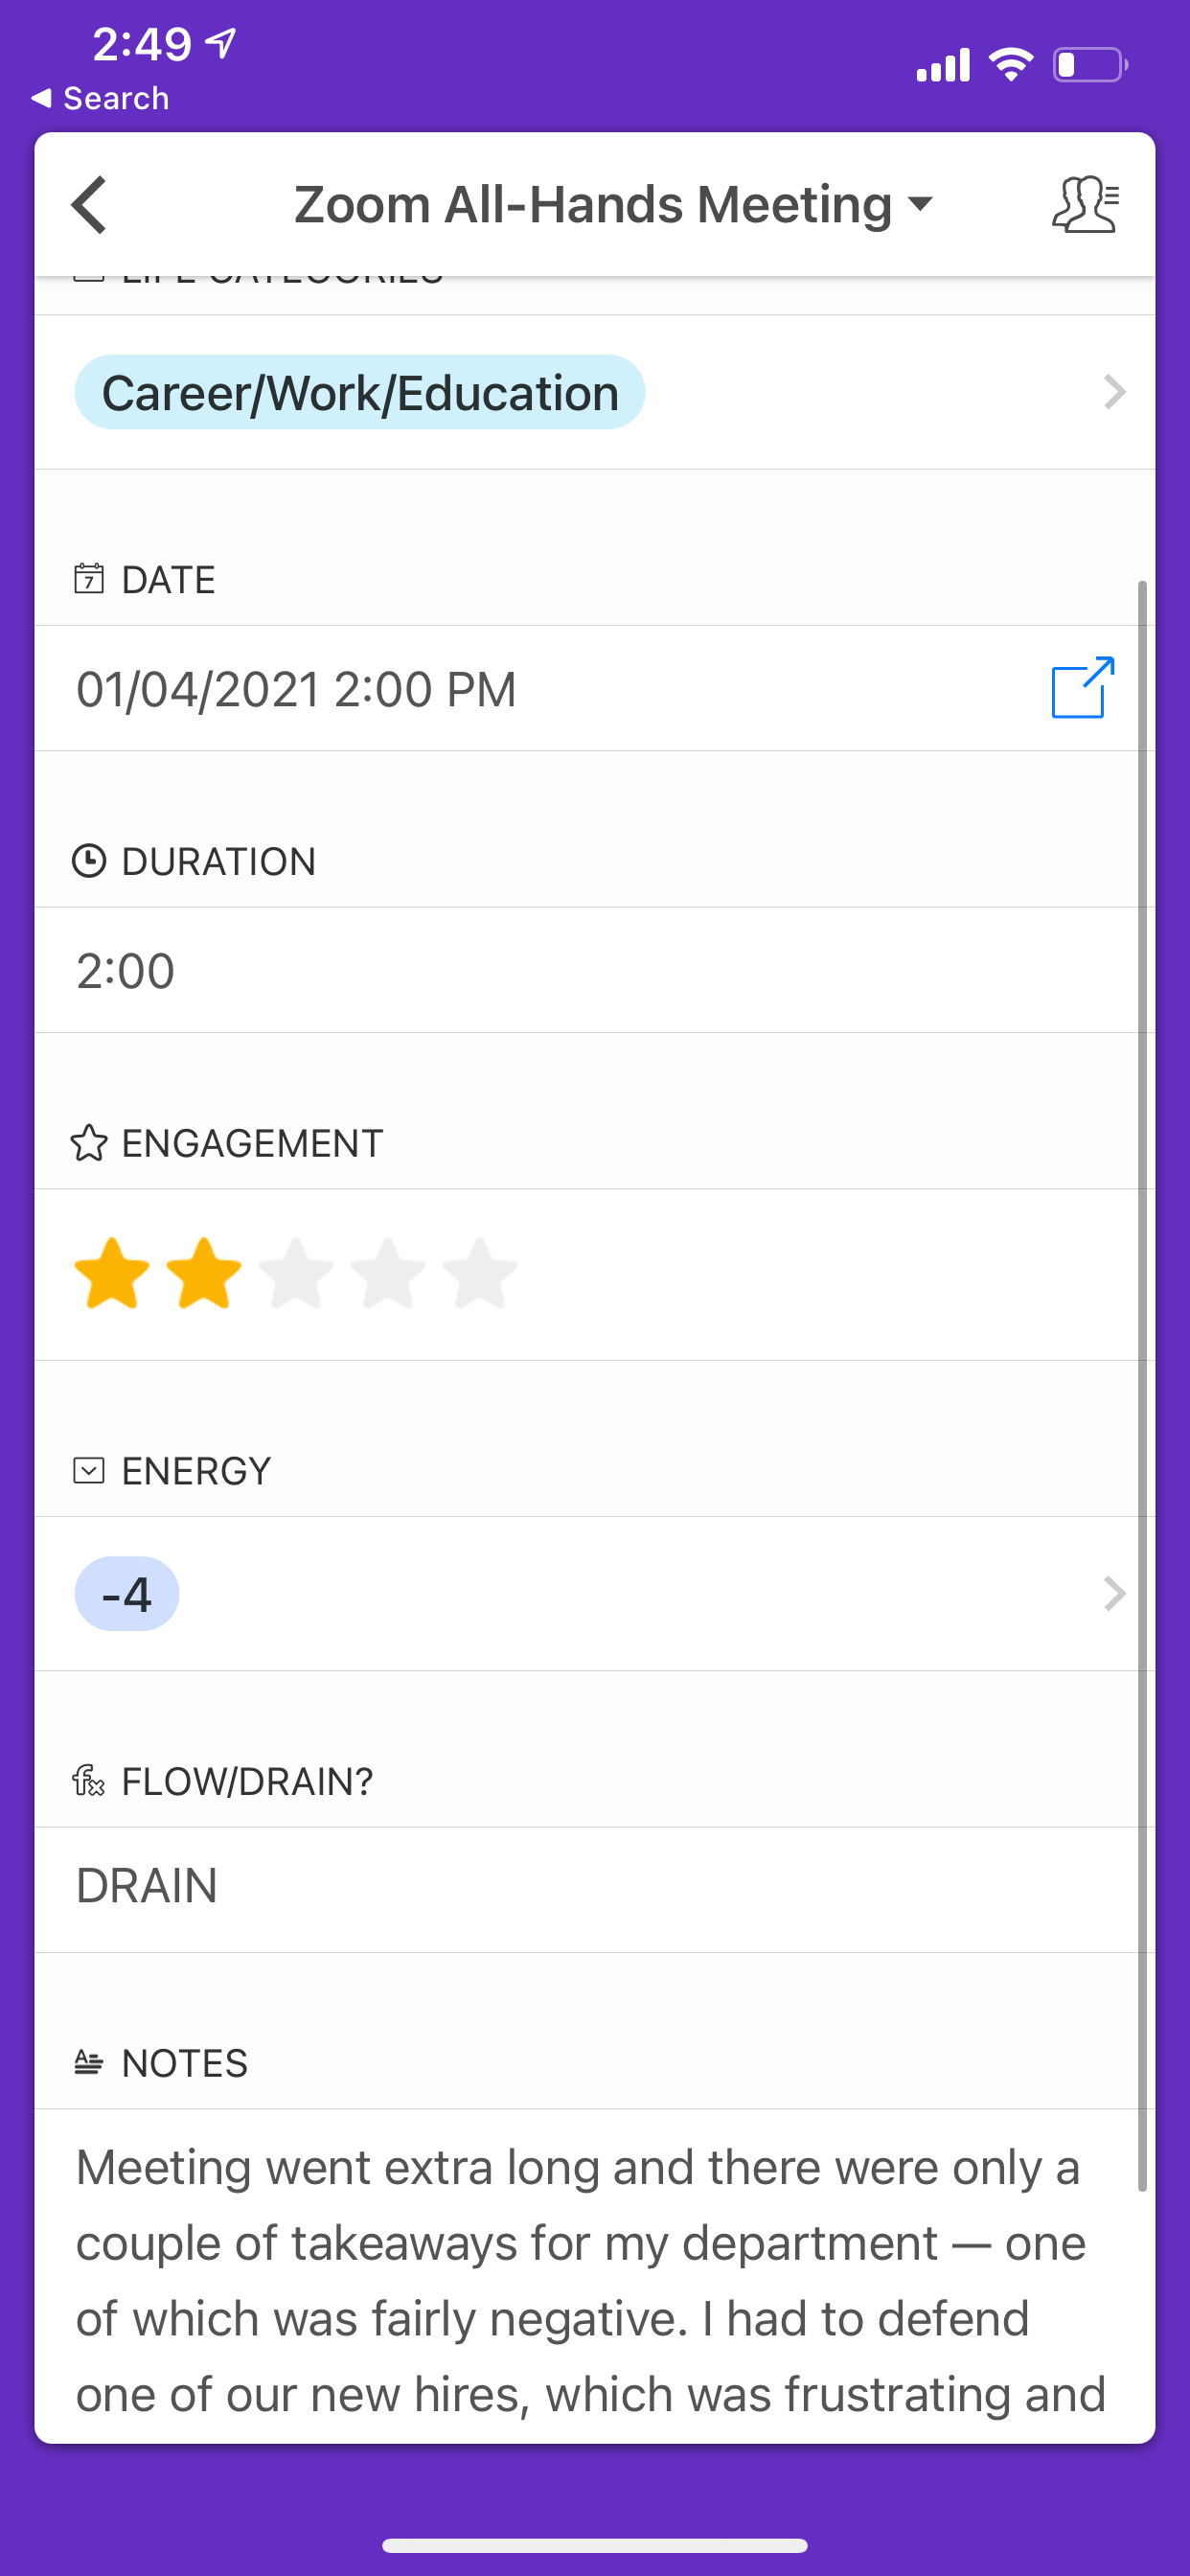
Drain
If a task/activity is rated as one with low engagement and also receives a negative energy impact score, you might have identified a possible drain— a type of activity that would ideally be delegated, removed, or scheduled intentionally to minimize the impact on other activities.
Low engagement + Negative energy impact→ Think: passive meetings, doom scrolling, chores that feel like sludge
Identifying drains lets you buffer, batch, or delegate more strategically.
Here is an example of a potential drain activity:
Other Metrics
The time of day, duration, life categories, and notes give more depth to your analysis.
Time and Duration
The time of day and duration metrics help clarify why an activity could be more/less engaging or impactful on energy (e.g. an extra-long or a late-day meeting can quickly become less engaging and/or more draining).
Life Categories
The life categories are commonly used areas for self-assessment and goal planning. Feel free to adjust these according to your preferences!
By categorizing in this manner, you have more insight regarding in what areas you might benefit from adding or removing activities, if your approach to operating in an area might need adjustment, and/or in what areas you're spending more or less of your time.
Included categories in guide or for your inspiration:
- Career/Work/Education
- Hobbies/Fun/Entertainment
- Personal Development
- Health/Wellness
- Financial/Wealth
- Environment/Home
- Family/Friends
- Partner/Love
- Community/Social
- Spiritual
Notes
Notes also help add context by allowing you to identify WHY you chose these scores. Maybe your environment, the client with whom you were working at the time, or a new way of approaching a task affected your perception. These contextual details help identify useful patterns and insights, as well!
You can also use the AEIOU method to help with reflection:
A: Activities – structured/unstructured, leader/participant, what was I actually doing?
E: Environment- inside/outside, what kind of place was it? how did it make me feel?
I: Interactions – with people/machines, informal/formal, new/familiar
U: Users- who else was I with? what role did they play in my experience?
What activities should I track?
First, start with activities that occur more frequently in your schedule, as well as those that are of a higher level of importance or carry weight in your day-to-day decisions and life.
Usually work-related, partner/family, household, and self-care/wellness categories are great places to start. You can even focus on one or two specific categories at first if that helps to facilitate the practice and integration of insights gained from your awareness and analysis.
As you get used to tracking, add in more detail to existing tasks, as well as track smaller entries. For example, meetings and presentations may be more of a priority to track first, but start to get more granular by logging the types of tasks supporting meetings/presentations, or specific recurring meetings/presentations with clients and your teams, etc.
You can use this template at a surface level and continually go deeper in your logging as needed — it’s a very flexible practice.


